富集分析可视化
富集分析是分析基因列表功能倾向性的常用方法。展示其结果的常用图形有条形图、点图和网络图等等。
点图
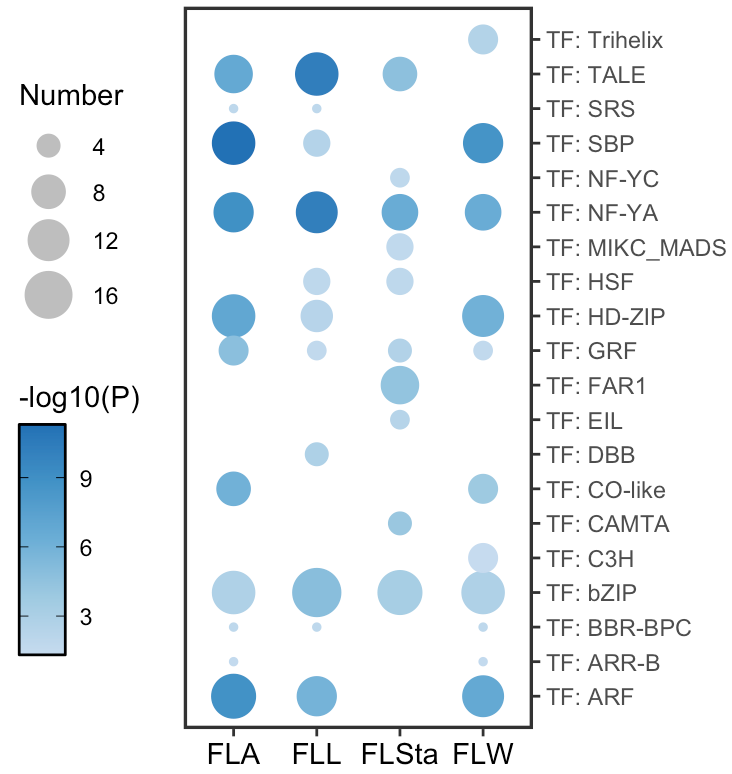
点图能够显示富集Term的显著性与效应大小(如富集倍数),是展示富集分析结果的一种直观方式。
数据准备
示例数据链接: 右键点击复制
library(tidyverse)

# Load the data
url <- "https://res.craft.do/user/full/5cc4bf2e-e733-e007-a61a-a9eddc2e4039/doc/0376635D-1D96-42C7-B159-CA35BE60F6A3/5194F445-7105-4A86-9E1B-4A3DD0BE9B43_2/mvJ3tYxlXfrM1yuLAdLqm7mQn9yXyBN7xqQcFX25u3sz/TF_dot_Data.csv"
TF_enrichment <- read_csv(url)
head(TF_enrichmet)

## # A tibble: 6 × 10
##  Gene_set Description Odds_Ratio        P p_adjusted All_Background All_maping
##  <chr>    <chr>            <dbl>    <dbl>      <dbl>          <dbl>      <dbl>
## 1 FLA      TF: SBP           23.8 5.14e-12   1.75e-10          24495         26
## 2 FLL      TF: TALE          18.2 5.09e-11   1.09e- 9          24495         30
## 3 FLL      TF: NF-YA         21.9 6.39e-11   1.09e- 9          24495         25
## 4 FLA      TF: NF-YA         18.6 1.31e- 9   1.89e- 8          24495         25
## 5 FLA      TF: ARF           10.7 1.67e- 9   1.89e- 8          24495         45
## 6 FLW      TF: SBP           17.4 2.19e- 9   5.47e- 8          24495         26
## # ℹ 3 more variables: Total_input <dbl>, Number <dbl>, Gene_ratio <dbl>
ggplot2 绘制富集分析点图
TF_enrichment %>%
  ggplot(aes(x = Gene_set, y = Description)) +
  geom_point(aes(size = Number,
                 color = -log10(P))) +
  labs(x = NULL, y = NULL) +
  # Add a size scale
  scale_size_continuous(range = c(1, 8)) +
  # Add a color scale
  scale_color_gradientn(colors = c("#c6dbef", "#9ecae1", "#6baed6","#4292c6","#2171b5")) +
  # Move the y-axis to the right
  scale_y_discrete(position = "right",expand = c(0.05,0)) +
  theme_bw() +
  theme(panel.grid = element_blank(), # Remove gridlines
        panel.border = element_rect(linewidth = 1.2),  # Adjust border width
        axis.text.x = element_text(color = "black", size = 11),
        axis.title = element_text(size = 12),
        legend.position = "left", # Move the legend to the left
        ) +
  # set the legend type and color
  guides(size = guide_legend(override.aes = list(color = "grey")),
         color = guide_colorbar(ticks.colour = "black",frame.colour = "black"))
