可视化案例
在生物信息学研究中,数据可视化是理解和解释数据的关键步骤。通过有效的可视化,研究人员可以更直观地展示数据的趋势、模式和关系,从而获得更深入的生物学见解。在这一部分,记录一些学习工作中R语言可视化案例。
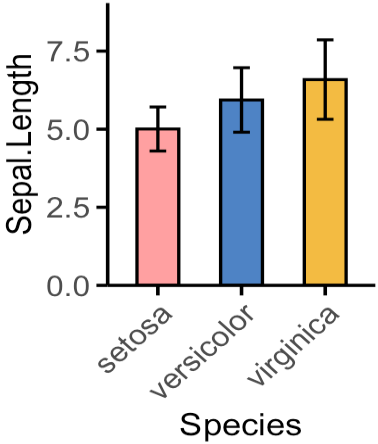
柱状图(Bar Plot)
df <- as_tibble(iris)
mycols <- c("#ffa0a1", "#4d83c5", "#f3bb42")

df %>%
  ggplot(aes(x = Species, y = Sepal.Length, fill = Species)) +
  geom_bar(stat = "summary",
          fun = mean,            # 计算均值
          size = 0.6,
          width = 0.5,               # 设置柱状图宽度
          color = "black") +         # 设置柱状图边框颜色
  stat_summary(fun.data = mean_sdl,  # 添加均值标准差误差线
              geom = "errorbar",
              width = 0.2,
              size = 0.6) +
  scale_fill_manual(values = mycols) +                         # 应用自定义颜色
  scale_y_continuous(expand = expansion(mult = c(0, 0.15))) +  # 控制 Y 轴扩展,使Y 轴底部没有扩展空间,顶部有 15% 的数据范围作为扩展。
  theme_classic() +                            # 使用经典主题
  theme(legend.position = "none",              # 隐藏图例
        axis.title = element_text(size = 13),  # 设置坐标轴标题大小
        axis.text = element_text(size = 12),   # 设置坐标轴文本大小
        axis.ticks.length = unit(0.15, "cm"),  # 设置刻度长度
        axis.line = element_line(size = 0.65, color = "black"),   # 设置轴线样式
        axis.ticks = element_line(size = 0.65, color = "black"),  # 设置刻度线样式
        axis.text.x = element_text(angle = 45, hjust = 1))
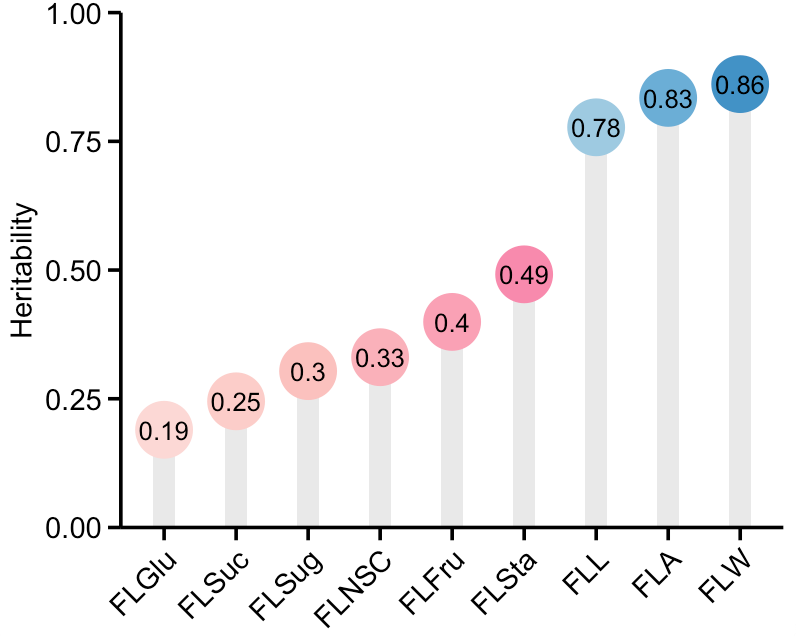
df <- read_csv("~/Desktop/Supplemental_Table_1.csv")
# 根据Heritability的大小对Traits进行排序
df <- df %>%
  arrange(Heritability) %>%
  mutate(Traits = factor(Traits, levels = unique(Traits)))
df %>%
  ggplot(aes(x = Traits, y = Heritability)) +
  geom_bar(stat = "identity", fill = "#E9E9E9",width = 0.3) +
  geom_count(aes(color = Traits),size = 9.5) +
  geom_text(aes(label = round(Heritability, 2)),size = 3.4, hjust = 0.5) +
  labs(x = NULL) +
  scale_y_continuous(expand = c(0,0),limits = c(0,1)) +
  scale_x_discrete(labels = c("FLGlu", "FLSuc", "FLSug", "FLNSC", "FLFru", "FLSta","FLL","FLA","FLW")) +
  scale_color_manual(values = c("#FCD8D5", "#FCCDC9", "#FBC1BE", "#FAB1BA",
                                "#FAA1B5", "#F88AAD", "#9ecae1","#6baed6", "#4292c6")) +
  theme_pubr(base_size = 11) +
  theme(legend.position = "none",
        axis.text.x = element_text(angle = 45, hjust = 1),
        axis.ticks.length = unit(0.17, "cm"),
        axis.line = element_line(size = 0.65, color = "black"),
        axis.ticks = element_line(size = 0.65, color = "black"),)
ggsave("~/Desktop/Heritability.pdf",width = 5, height = 3.8)
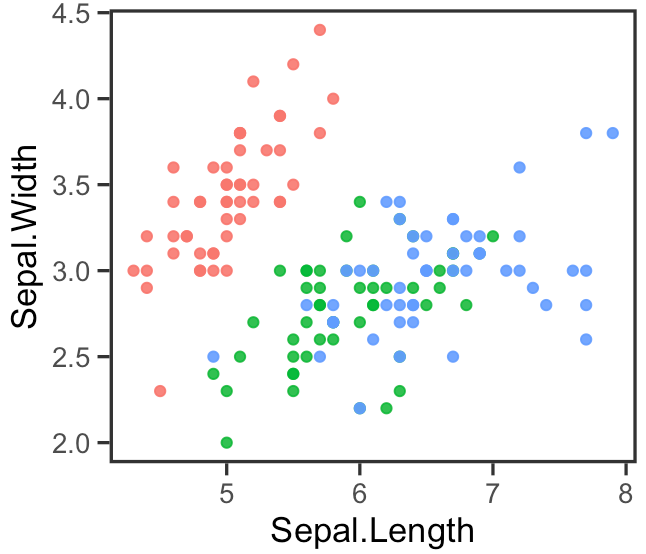
散点图(Scatter Plot)
# 加载必需的库
library(ggplot2)
library(dplyr)

# 使用管道操作符 %>% 来处理数据和创建图形
df %>%
  ggplot(aes(x = Sepal.Length, y = Sepal.Width, color = Species)) +  # 设置aes映射,定义x、y轴数据和颜色分组
  geom_point(size = 1.5, alpha = 0.9) +                             # 添加点图层,设置点的大小和透明度
  theme_test(base_size = 13, base_rect_size = 1.2) +                # 使用theme_test主题,调整基本字体大小和矩形大小
  theme(legend.position = "none",                                   # 隐藏图例
        axis.ticks.length = unit(0.16, "cm"))                       # 设置坐标轴刻度的长度
火山图(Volcano Plot)
热图(Heatmap)
样品相关性矩阵热图示例数据
library(tidyverse)
library(pheatmap)
library(RColorBrewer)
library(showtext)
showtext_auto() # for Chinese characters
加载数据
data <- read.csv(url.1, header = T,row.names = 1)
# transform the data to a matrix
data_mt <- as.matrix(data)

# columns ann file
ann_col <- read.csv(url.2, row.names = 1)
ann_colors <- list(大区 = c(东北="#f08961", 华北="#f0ad00", 西北="#ffa0a1",
                            华中="#c7231f", 华东="#3578ad",
                            华南 = "#4f2580", 西南="#63b99e"))

# Set the color for the heatmap
mycols <- colorRampPalette(c("#5fa5d9", "white", "#e65100"))(100)
Draw heatmap
进化树
library(ggtree)
library(ggplot2)
library(RColorBrewer)

clist <- list(
  "mycolor"=c("#97A1A7FF","#4d83c5","#74ab4d","#e61f19","#fe9929")
  "shiny"=c("#1D72F5","#DF0101","#77CE61", "#FF9326","#A945FF","#0089B2","#FDF060",
            "#FFA6B2","#BFF217","#60D5FD","#CC1577","#F2B950","#7FB21D","#EC496F",
            "#326397","#B26314","#027368","#A4A4A4","#610B5E"),
  "strong"=c("#11A4C8","#63C2C5","#1D4F9F","#0C516D","#2A2771","#396D35","#80C342",
             "#725DA8","#B62025","#ED2224","#ED1943","#ED3995","#7E277C",
             "#F7EC16","#F8941E","#8C2A1C","#808080"))

# 读取文件
groupfile <- read.table("group.tsv",sep = '\t',header = T)
tree <- read.tree("iqtree.tree")

# 准备颜色分组
grouplist <- split(groupfile$Sample, groupfile[,"Group"])
tree <- groupOTU(tree, grouplist, "Population")


ggtree(tree, aes(color=Population), alpha=0.8,layout='equal_angle',size=0.3) +
  coord_flip() +
  scale_color_manual(values = c("#97A1A7FF","#4d83c5","#74ab4d","#e61f19","#fe9929")) +
  theme(legend.position='right')


