Python可视化
setting
# 查看默认颜色循环
plt.rcParams['axes.prop_cycle'].by_key()['color']
# 查看当前使用的字体类,以及其包含的字体,默认使用字体集的第一个字体
plt.rcParams['font.family']
plt.rcParams['font.sans-serif']

# 更改全局字体设置
plt.rcParams.update({
'font.family': 'sans-serif',
'font.sans-serif': ['Helvetica', 'Arial', 'DejaVu Sans', 'Bitstream Vera Sans', 'Computer Modern Sans Serif', 'Lucida Grande', 'Verdana', 'Geneva', 'Lucid', 'Avant Garde', 'sans-serif']
})
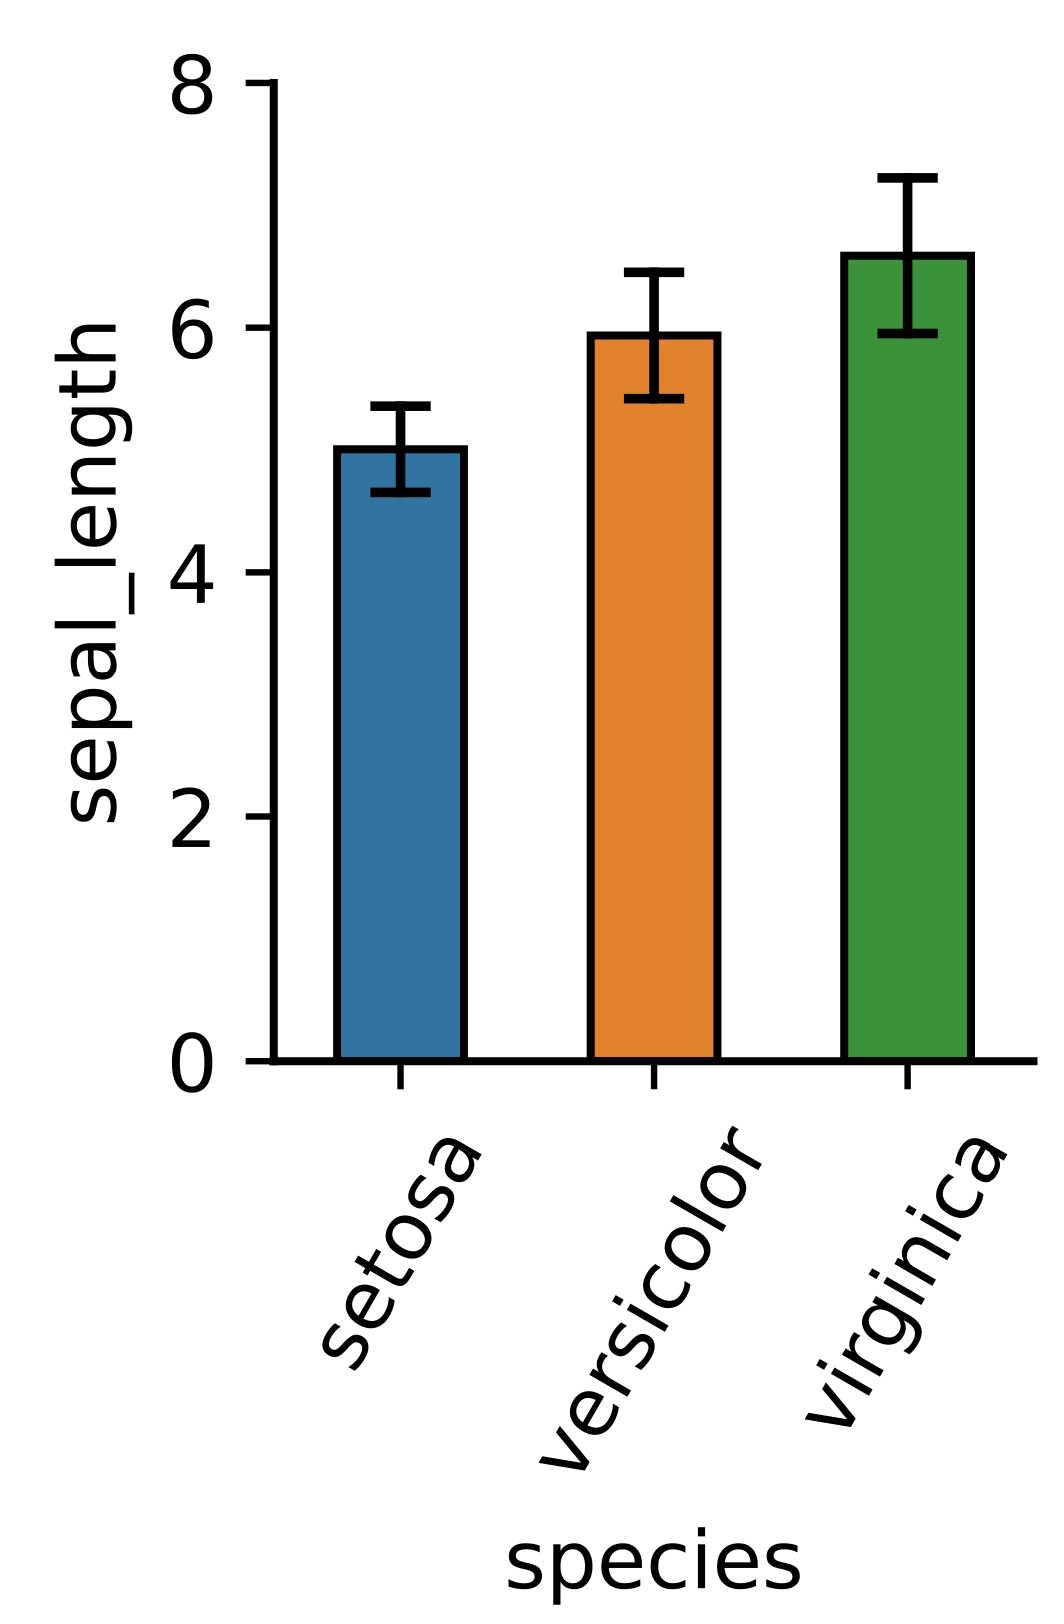
一. bar Plot
plt.rcParams['axes.linewidth']  # 查看axes边框粗细
plt.setp(ax.spines.values(), linewidth=1) # 设置边框粗细

# 第二种方式设置标题倾斜45度,并且右端对齐。
plt.setp(ax.get_xticklabels(), rotation=45, ha="right", rotation_mode="anchor", y=0.02)

# 添加数字,显示bar的具体数值
ax.bar_label(ax.containers[0], fontsize=10)

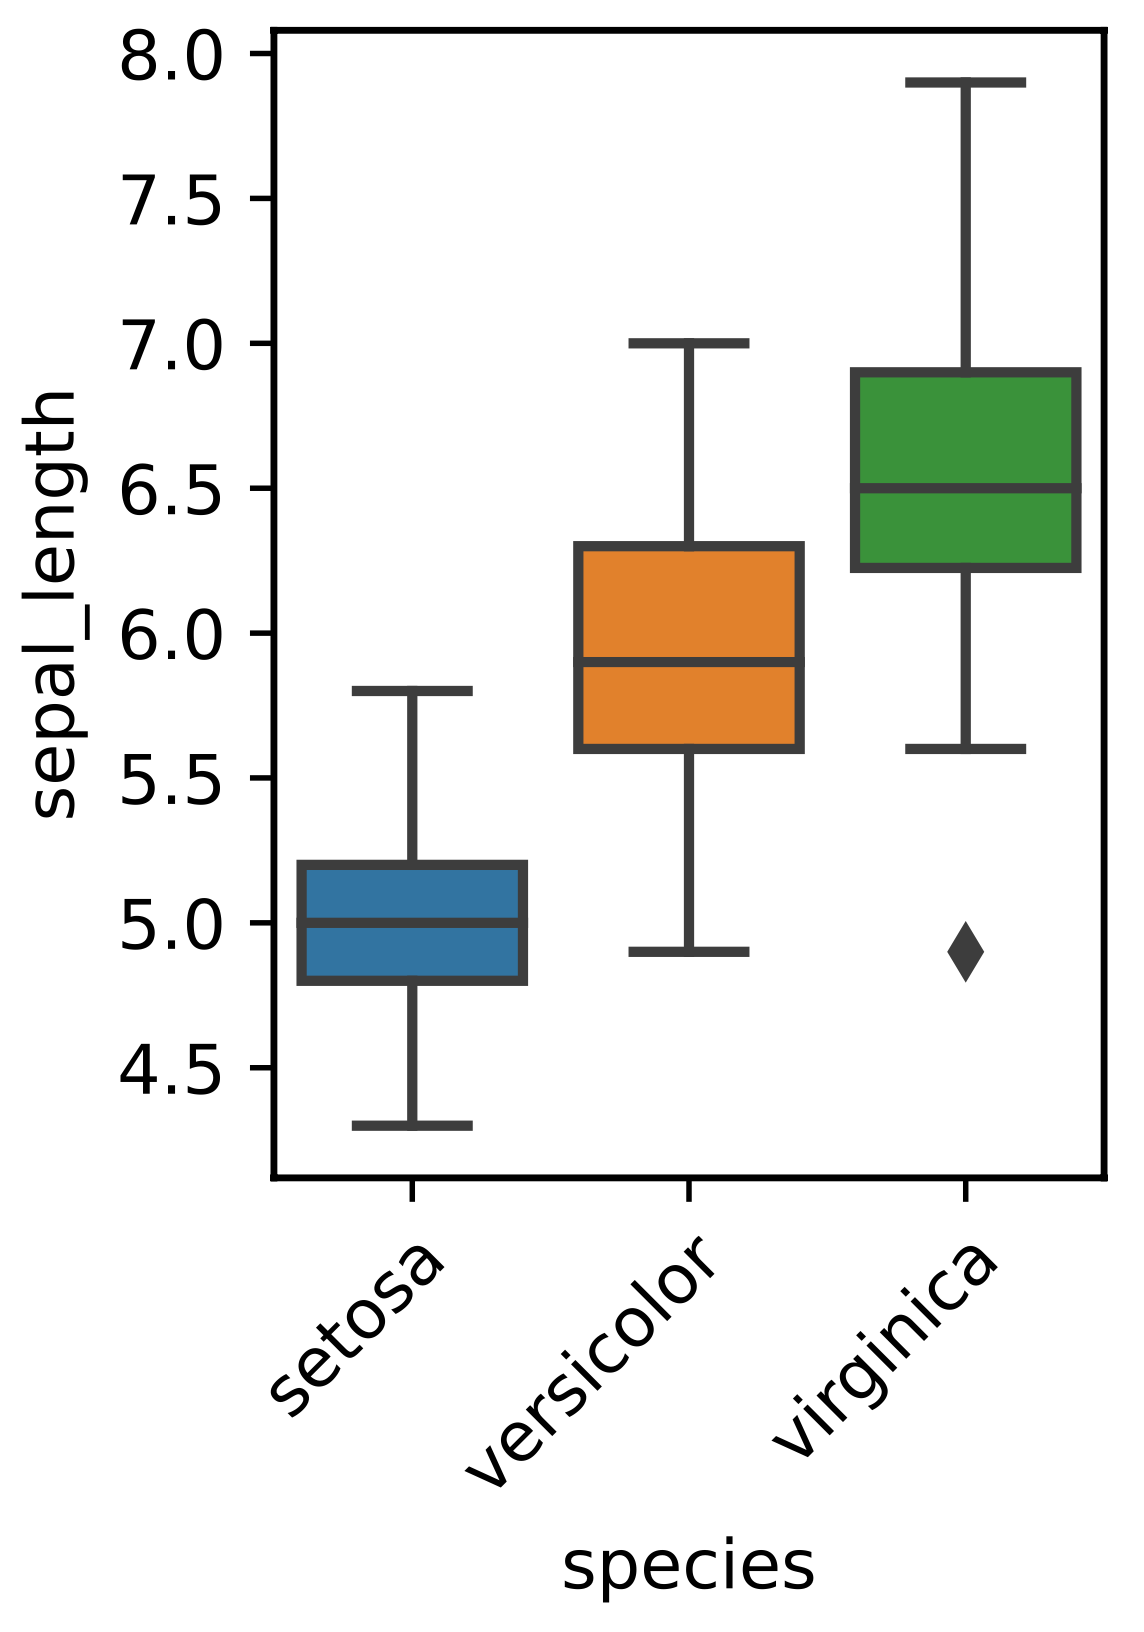
二. boxplot
# boxplot

fig, ax = plt.subplots(figsize=(2.5, 3.5))
sns.boxplot(data=df,
x='species',
y='sepal_length',ax=ax)

# 获取箱线图的线条
lines = ax.lines

# 设置竖线(胡须)为虚线
for i, line in enumerate(lines):

# 找到胡须线并设置为虚线
if i % 6 in [0,1]:  # 第1和第2条线是胡须线
line.set_linestyle('-')

# set plot arguments
plt.setp(ax.spines.values(), linewidth=1) # set the border width

plt.setp(ax.get_xticklabels(), rotation=45, ha="right", rotation_mode="anchor")
plt.tight_layout() # adjust the layout

# store the figure
fig.savefig('/Users/wuyang/Desktop/test3.pdf')

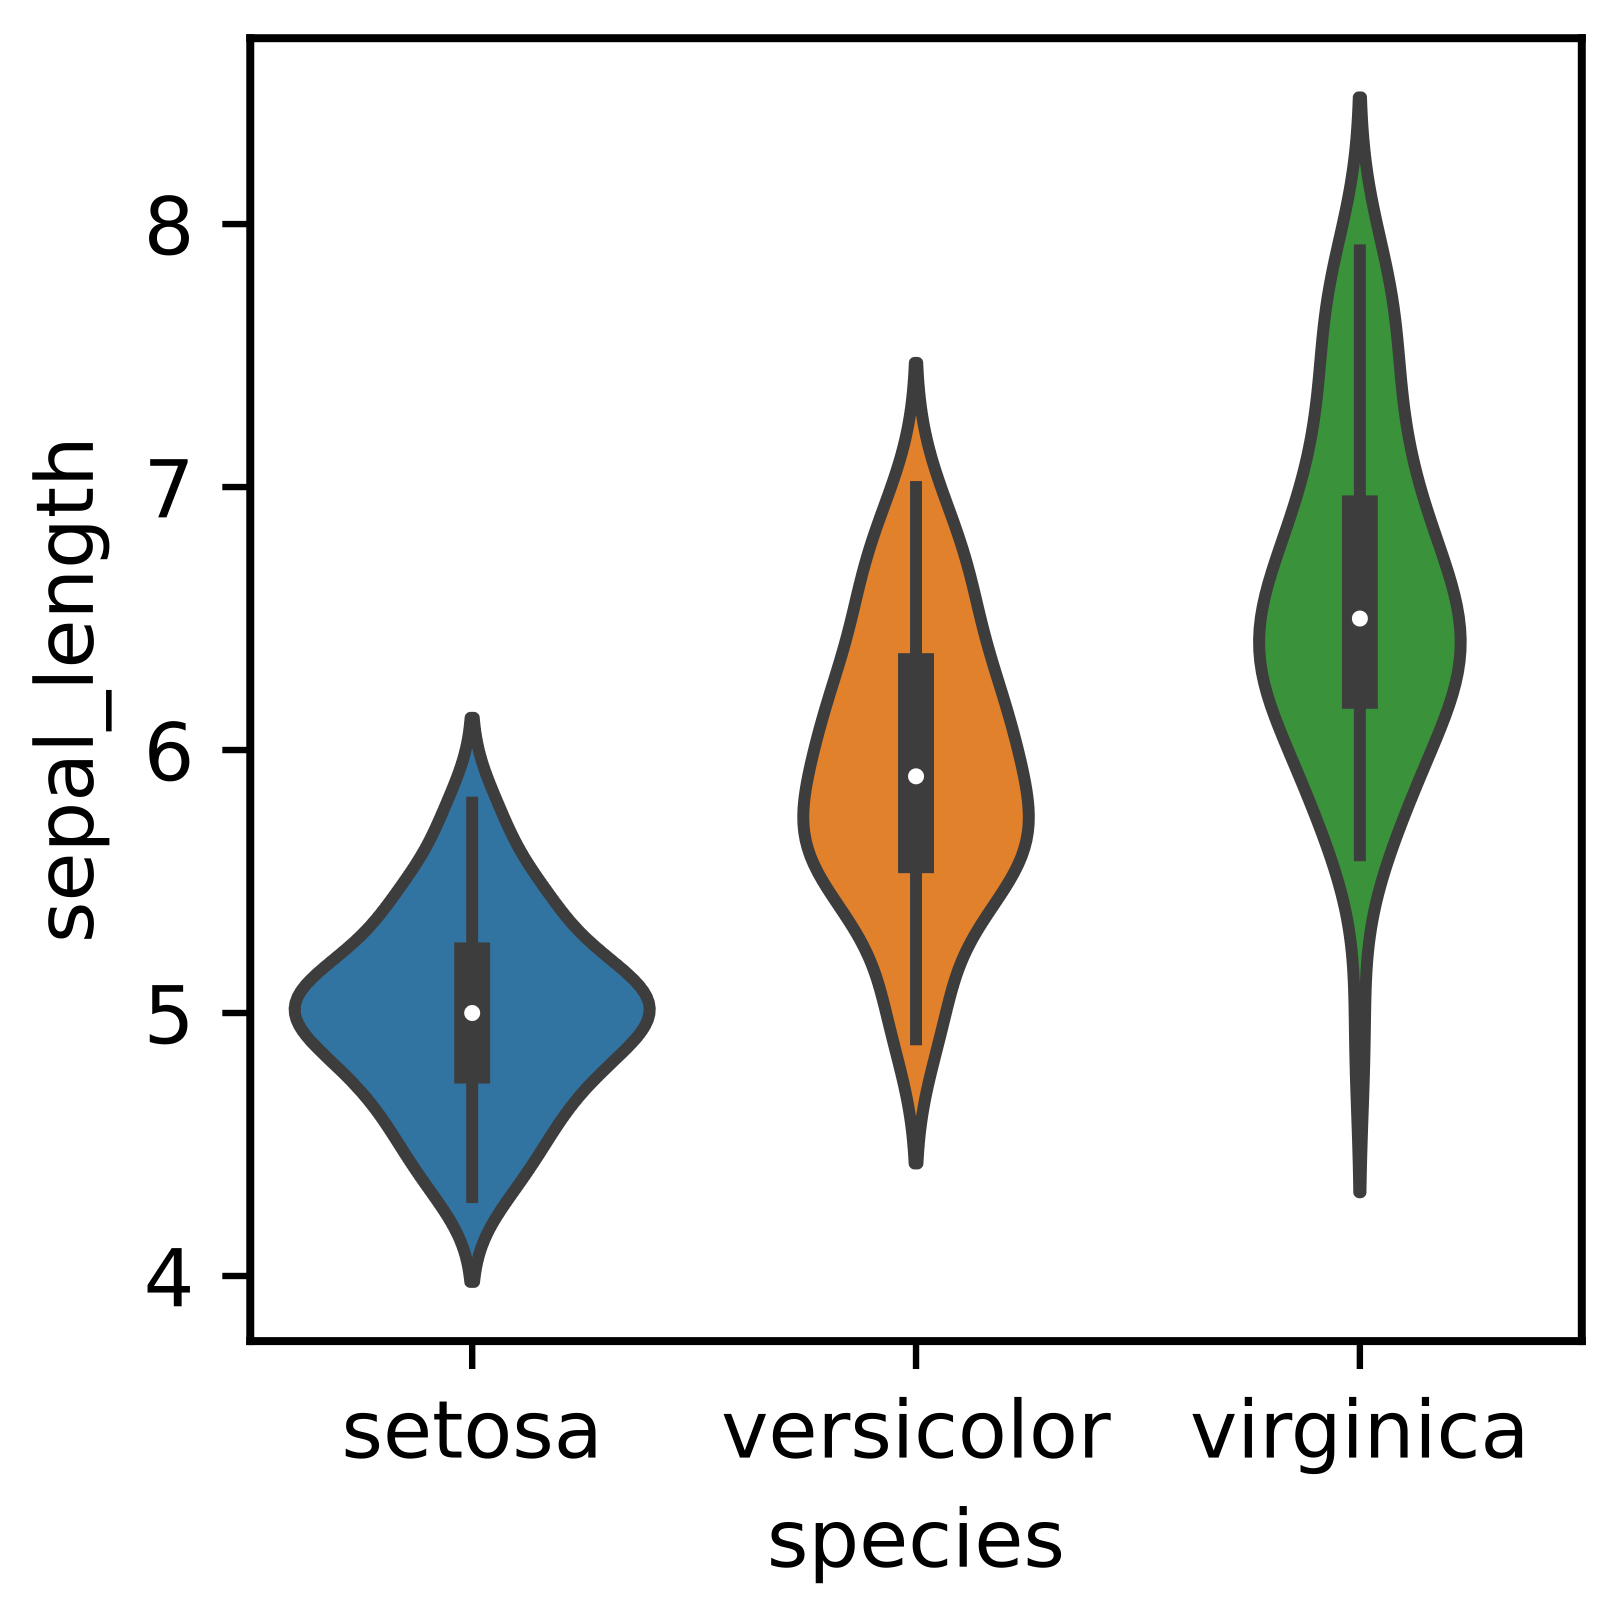
三. violin plot
# violin plot
fig, ax = plt.subplots(figsize=(3.5, 3.5))
sns.violinplot(data=df,x='species',y='sepal_length',inner='box',ax=ax)


